A.I. Investing:
Machine Learning Predictions for Individual Stocks and Financial Assets
A Robust Investment Performance Architecture


Genesis
This machine learning prediction system is the product of 5 generations of work towards a commercial result in collaboration with Cornell’s Masters of Applied Statistics. We have been working with Cornell now coming into our 7th year and for many such years we have worked on machine learning predictions and made many failed attempts in our journey.
We have had our successes too and below we outline the schematic of our A.I predictions, having assimilated many of our successes and avoiding those pitfalls encountered along the journey. We shall keep the technical jargon out of it as our intended audience is sophisticated investors.


Machine Learning Model Design Patterns
The prediction system is built using a hierarchical composition of various prediction systems. In this way, the machine learning predictions mimics a prediction scheme that futurist and author Ray Kurzweil talks about in his book, “How to Build a Mind.” That book is largely concerned with the building of a general intelligence. Kurzweil draws strong parallels between successful machine learning or artificial intelligence and the way the human brain works in a hierarchical manner giving rise to the neocortex capable of abstract and creative thought.
Another analogy is that of weather forecasting. Now, weather forecasting represents the composite of tens of thousands of barometric, wind, humidity and temperature readings all over the globe, especially when combined with centuries of recorded weather for any given date, meteorologists can now forecast the weather better than any time in our history. To forecast the weather in Poughkeepsie You don’t forecast the same way as you would for San Antonio, TX. The forecast for July 25th is quite different than for December 25th.
So it is with predictions for stocks. In order to create a globally efficacious prediction model, we believe that you can build it up from successful smaller models.
Stock market predictions will never see the type of success as weather forecasting. We must recognize our fallibility. However, recall Benjamin Martin’s shooting advice in the movie, “The Patriot”, “aim small, miss small.”
If your expectation for machine learning forecasts is to get rich quick, you will see the usual result. If your expectation is to consistently add a few points of return to a prudent investment process, then you are in the right place.
A history of stock forcasting:


With our extensive background in portfolio optimization, generating expected returns for investment candidates is a paramount input. For many years, our various software platforms including https://gsphere.com , https://gravityinvestments.com and https://portfoliothinktank.com have built portfolios where the expected returns are produced for any data based on a multi-sampling expert system. That is to say that we are using historical performance to predict the future by more optimally selecting multiple historical periods previously observed to offer a predictive advantage. This technique has served investors well and has been demonstrated to offer a predictive advantage as measured by an in-sample, out-of-sample correlation approximately .25%. More than half of this comes from the momentum signal. Momentum is regularly observed to be the factor offering the greatest return and is a nice bed fellow within a diversification portfolio strategy. For a nice chart on factor performance see; https://www.visualcapitalist.com/factor-investing/
Our success in these quantitative forecasting methods has served as a hurdle rate that any machine learning prediction must beat
for it to serve customers better than our existing systems.
Also, having built perhaps the best portfolio backtesting engine in the industry, we have been zealous about biases and proper
controls processes to ensure the utmost integrity of results.
These two traits served as both barriers and stepping stones enabling Portfolio ThinkTank to take the long view in designing our stock market prediction system.
Machine Learning Model Description


First thing we did was decide that each stock should have its own prediction model. This means that the data used to predict each
stock is uniquely trained to the specific dynamics of that stock.
The prediction for each and every stock is a composite of three separate prediction systems. A prediction for the stock market, a prediction for the sector and a prediction model for the stock’s alpha: Alpha is the return that a stock generates independent of the stock market influence.
The logic follows from straight forward investment thinking. Building on the Nobel prize winning work of William Sharpe and the
Capital Asset pricing Model (CAPM): each stock prediction follows a basic regression equation:
ERi = Rf + Bi(ERm – Rf )
ERi = Expected Return of Investment
ERm = Expected Stock Market Return
Rf = Risk free rate of return (yes Risk free is a fallacy, buts it not material so bear with me)
Bi = Beta of the investment
Assuming that the risk free assets offers no effective real return (after inflation) we can simplify the equation to:
ERi = ERm * Bi + Alpha.
This is called a single factor model.
We are using a 2 factor model with both the return on the stock market and the return of the sector. Assets performance is strongly explained by these three factors, so predicting them well can yield a tremendous advantage.
Accordingly our process takes the form:
ERi = ERm* Bi ERs * BSIS + Alpha.
In this model, each stock has its own predicted machine learning model Alpha. Then it shares the predictions
for the sectors and market using its own unique observed Betas.
That alpha is computed primarily from information on the company’s financial reports. We use about 70 data points from the financial statements and then expand those 70 data elements across ratios and multiple time scales to create about 300 data features for every stock. The machine learning algorithms find the most predictive combinations of these features and discard the data features with no explanatory power.
As an update to a simple market forecast, we are predicting the return from both the stocks, sector beta and the stocks market beta as the two combined offer much more explanatory power. These are powered by a cadre of economic
data and performance data of key indices.
Machine Learning Stocks Prediction Results and Analysis
The chart below provides the results of the meta model’s annual return predictions for 1926 U.S stock exchange listed stocks having sufficient history and data to qualify for the model. 1926 represents the subset of the Russell 3000 Stock Market Index that we had sufficient financial statement history for at the time of the research in Spring 2022.
The tests cover the 1926 stocks from 2014 through 2021 with each stock’s predicted return correlated against the actual return produced for the same prediction period. Each asset is correlated against its quarterly predictions and gives one observation to the histogram below. A correlation of zero would suggest that predictions were random and a correlation of 1 suggests perfect clairvoyance.
Considerable and assiduous efforts are taken to ensure bias mitigation. This includes, walk forward out of sample validation, separation of models into training testing and validation, careful review of feature data, sensible governance of feature data and selection and perhaps especially, selection of bias minimizing objective functions.
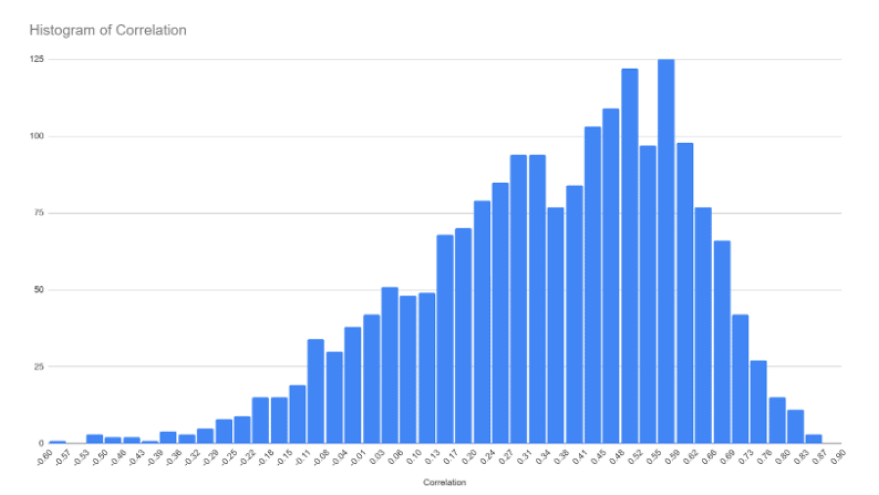

For further interpretation, you can conclude that any value with a negative correlation is a bad prediction. While a full 10% of our predictions could classify as a bad prediction we can also see that only 1.5% would count as a really bad prediction, having a correlation less than -.25. It follows then that our directional accuracy is 90%.
The hard part of conducting such a test is not in producing an attractive result, but in ensuring that any returns produced can be trusted.
The elimination of biases is not easy. This is the downfall of most machine learning projects.
Here, follows a year-by-year examination of the results of the tests, followed by an aggregate.
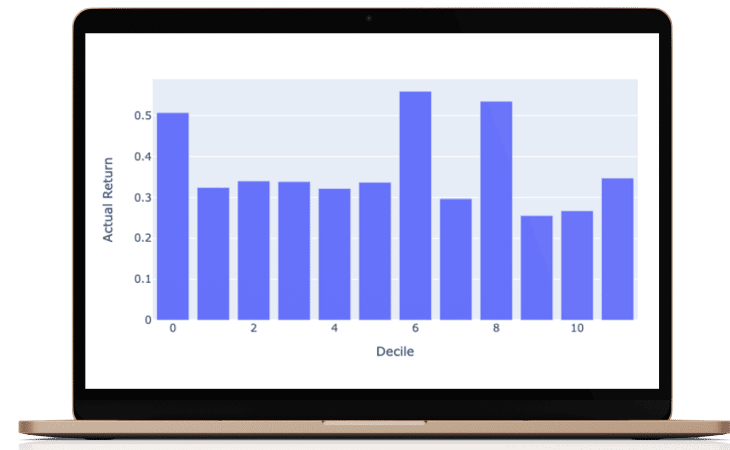
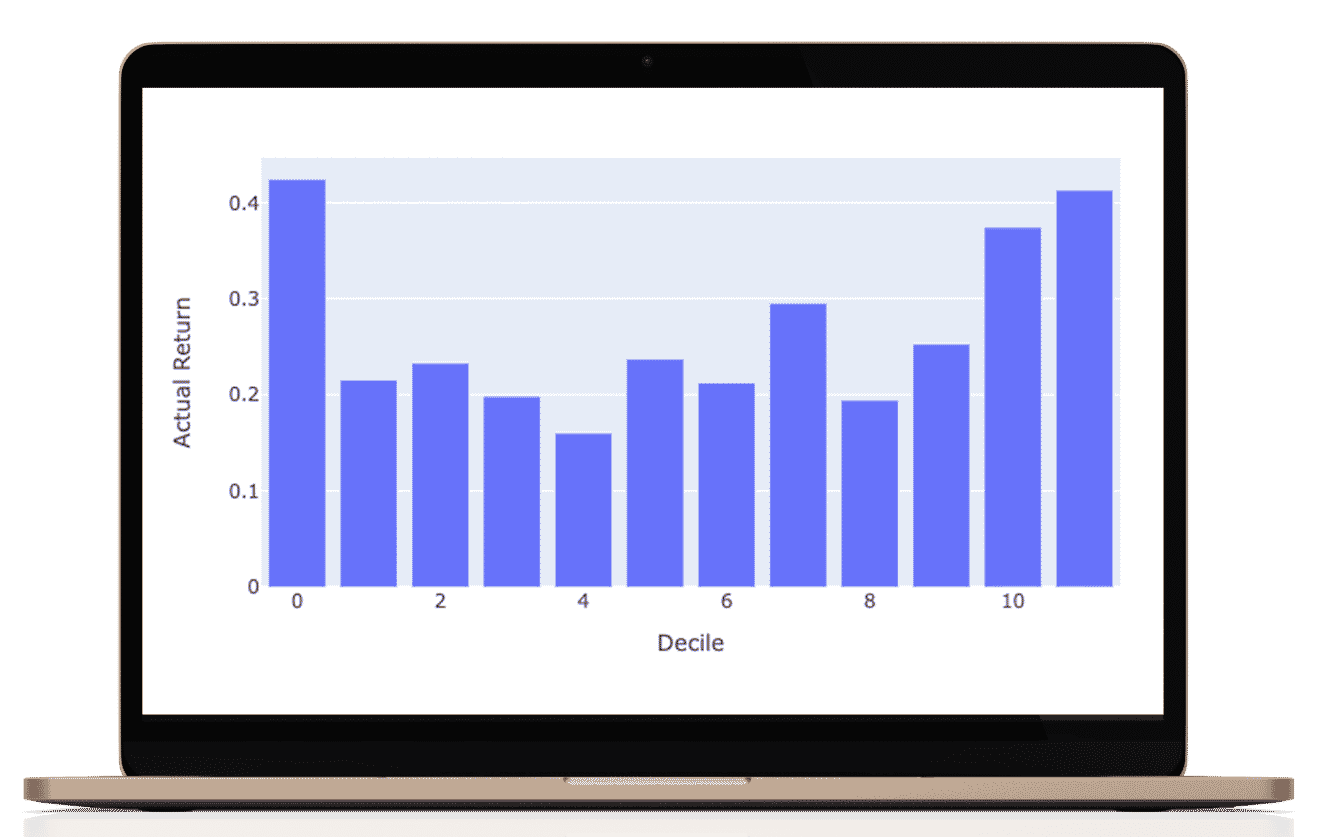
What I love about this manner of performance evaluation is that it is easy to understand in investment terms the success of the results. Do the actual returns grow steadily? To make these graphs we classify all of our predictions into 8 octiles (labeled as deciles). The rightmost octile (bar) consists of the ⅛ of the 1926 stocks with the highest predicted return for that period and the leftmost octile with the lowest predicted return. If then, the actual returns which are graphed conform to the shape then we know we are adding predictive value.
As you can see, the results are not perfect (never trust perfect A.I based stock predictions!) but are good enough to obtain a realistic and persistent performance advantage.
We tested a few variations around the Time Horizon. In these charts, Time Horizon 4 means 4 quarters or a 1 year prediction. Our results were comparable across multiple time horizons, which we have configured as an input variable for generating the predictions. Window size refers to the amount of history data we used. Window size = 0 means we use all the data available preceding the date of the prediction. We observed that the more data we used, the better the results; this is common in machine learning applications.
Year by year Decile performance
you can scroll the years to see each year's predicted vs actual performance




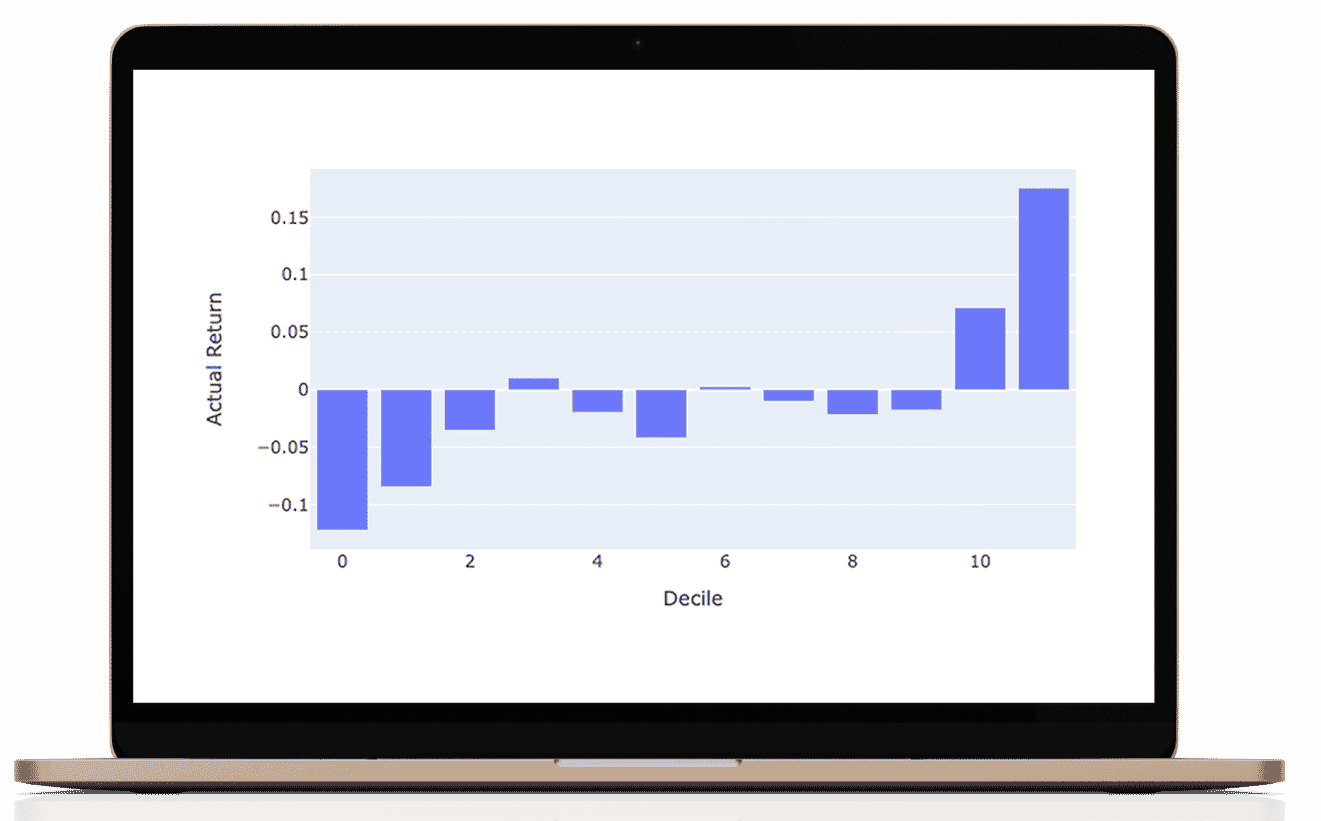


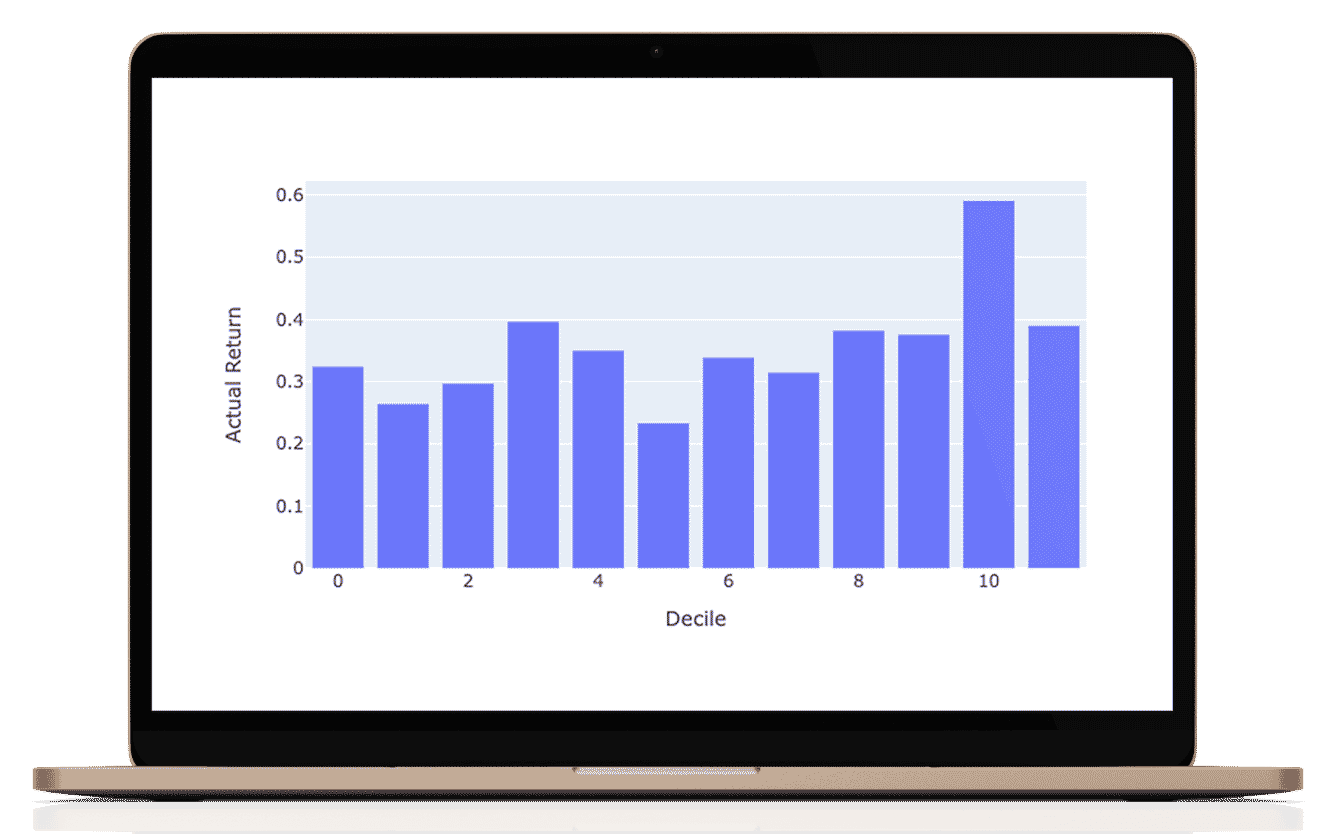


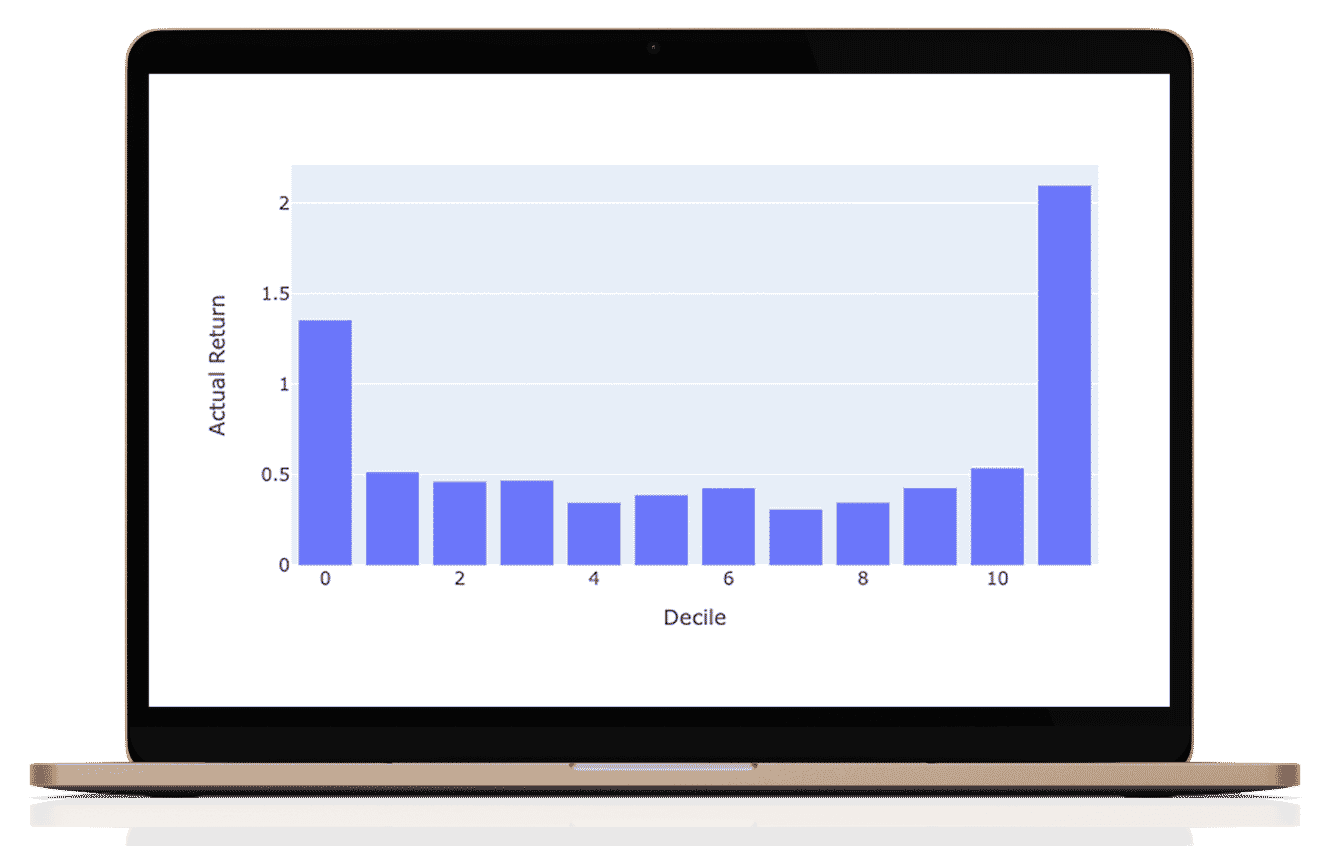


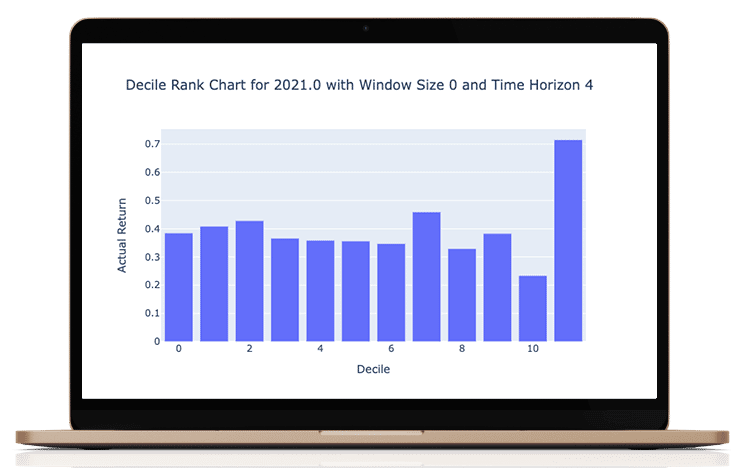


Aggregate performance 2016-2021
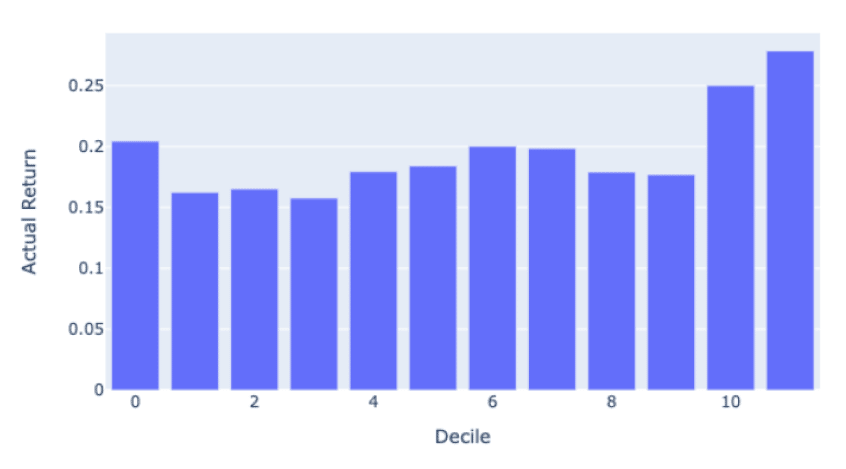

For this period, the S&P 500 produced an annual return of 14.75% and the S&P 1500 produced an annual return of 14.50%.
Portfolios selected from our top decile over the same period would average a return of 28%.
Accordingly, one could judge the performance of the model by buying the top decile and shorting the bottom decile. This long / short, market neutral portfolio strategy would yield nearly 8 % return.
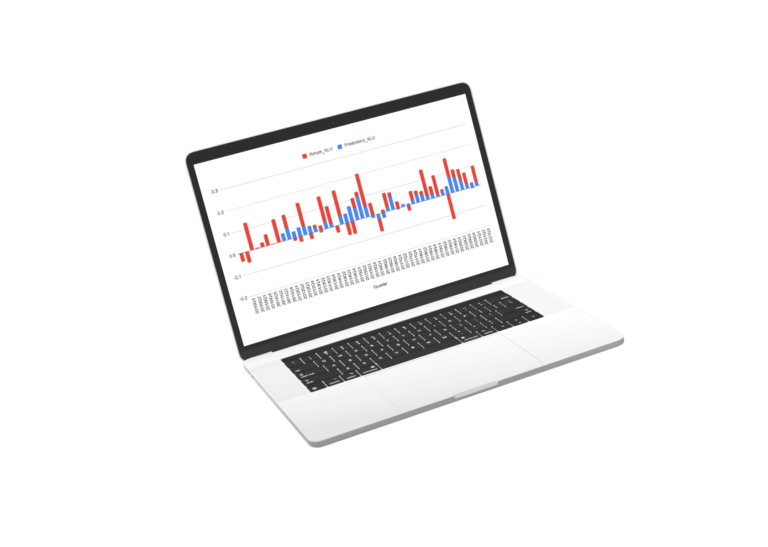
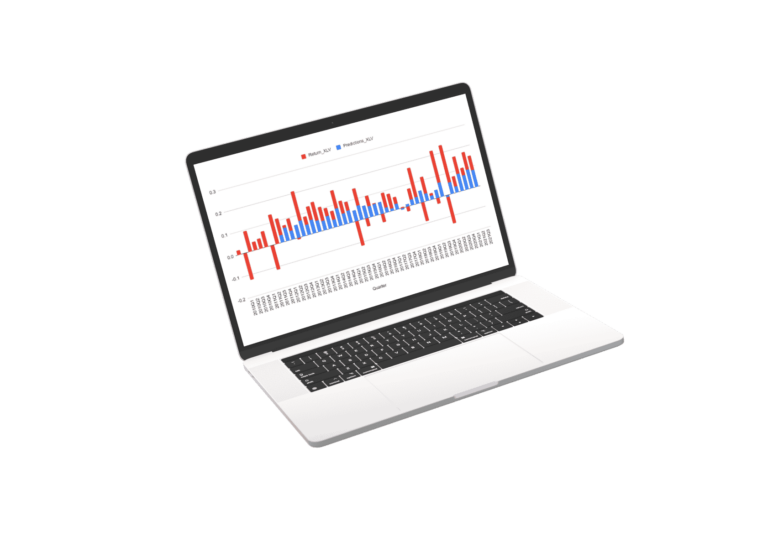
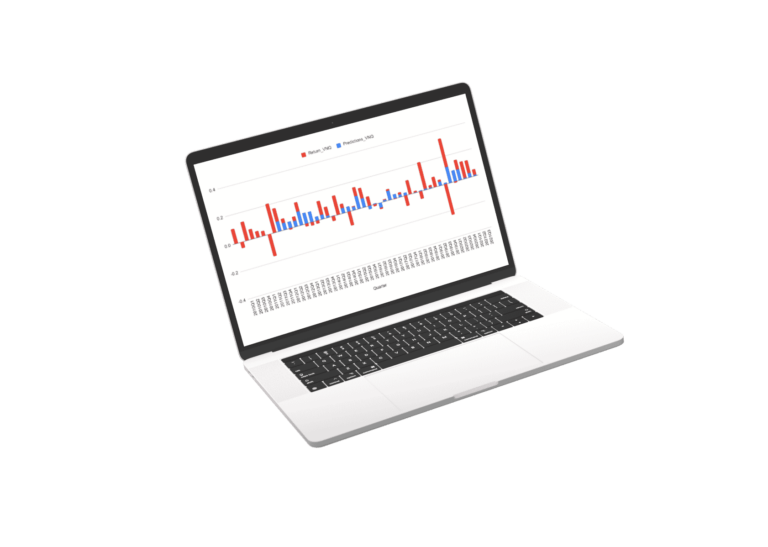
Results of Market and Sector Models
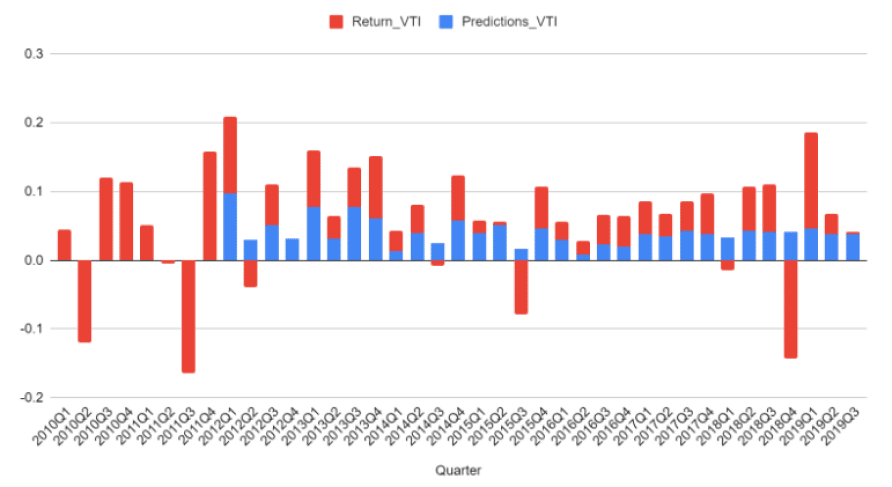

Scroll the charts blow to explore the performance of the sector models. for the sectors we used a regression of the best fit sector irrespective of SIC or S&P classification.
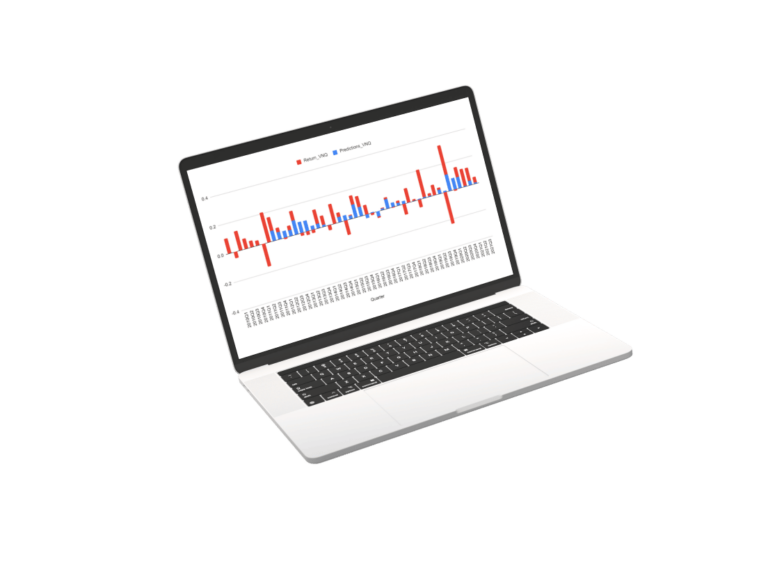
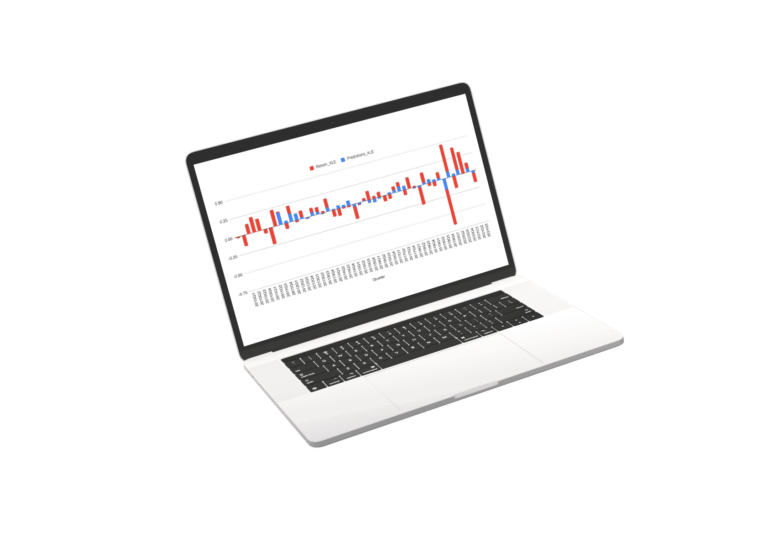
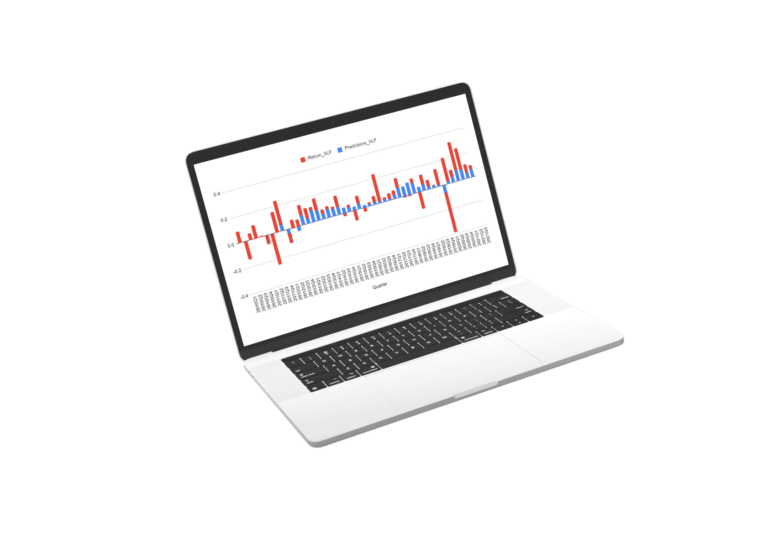
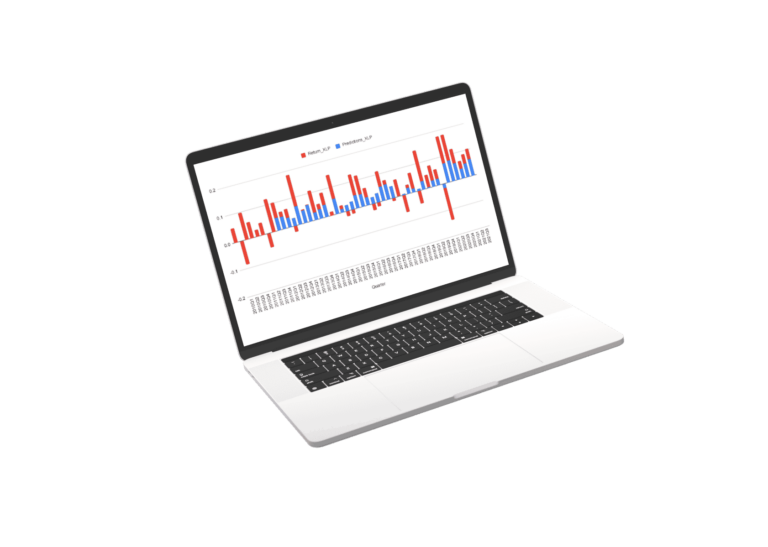
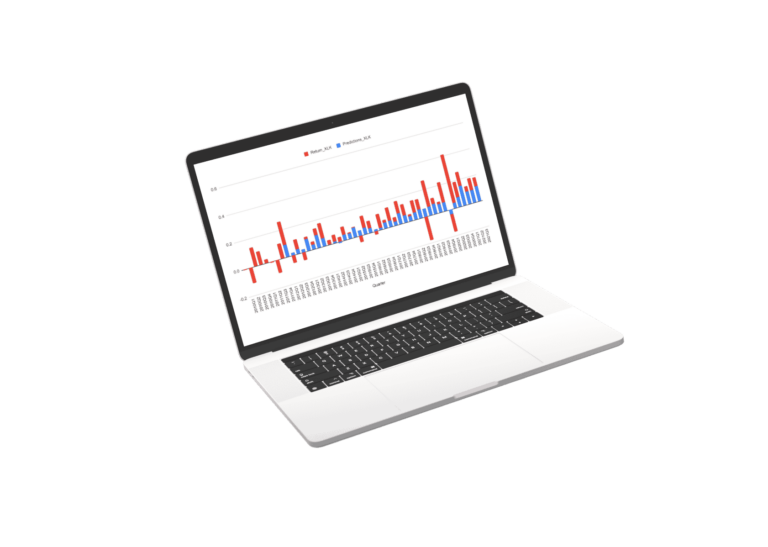
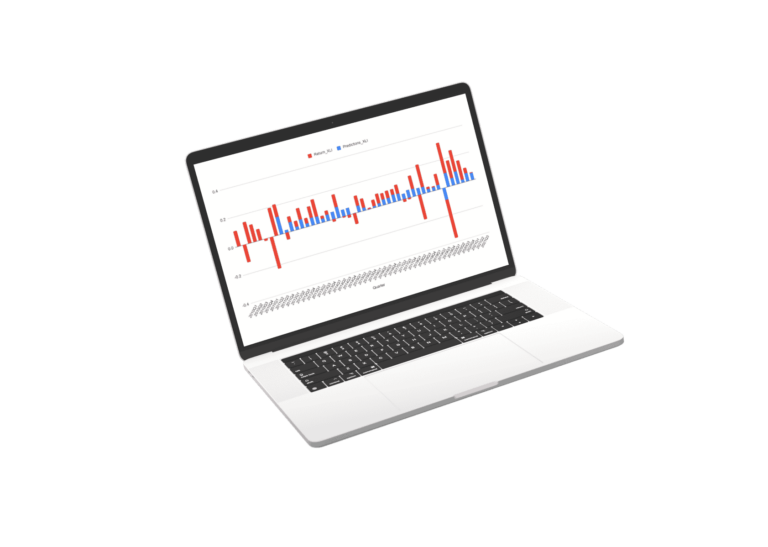
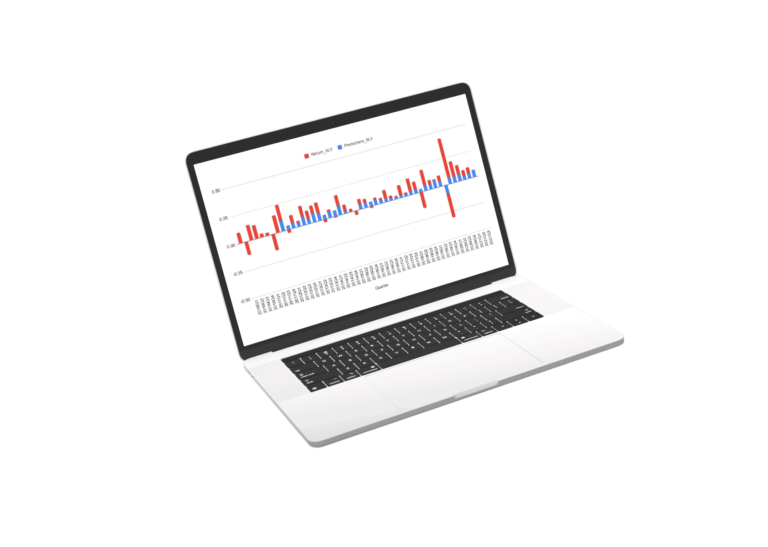
The Future
More data. More features, more models, more results, more learning. This is a machine learning flywheel. As we continue to build out the model, we expect results to improve.
We believe that the combination of stock specific ML model formation set within the CAPM prediction architecture provides a real opportunity for the predictions to help in delivering better performance for investors across assets, economic conditions and time.


AUTHOR
James Damschroder


ACKNOWLEDGEMENTS
Special thanks to Marissa Rubb for her steady work on the project, to Professor Diciccio as an Academic advisor, Xiaolong Yang, Ph.D., Sr. Lecturer, Sr. Associate Director, MPS Program and all of the students having made contributions over the years.
Important Disclosure about A.I., Backtesting and Hypothetical Performance
This portfolio or research is hypothetical. This is a historical simulation of the portfolio performance an investor would have obtained had you invested in the same selections at the beginning of the simulation. This report provides information on how the portfolio holdings would have changed and would have performed for a certain period.
We have strived to reduce or eliminate potential biases in the process to provide the most accurate assessment of the performance prospects of the strategy. Because Portfolio ThinkTank offers a significant However, it may not be possible for any historical simulation to completely ensure it is free of all biases.
Please see https://portfoliothinktank.com/the-gold-standard-for-portfolio-backtesting/ and https://portfoliothinktank.com/the-seven-deadly-sins-of-portfolio-backtesting/ for a more complete understanding of biases and risks when backtesting portfolio strategies.
Backtested strategies also run the risk of cherry picking. Cherry Picking is when the author of the backtest has created many variations and is presenting one of the variations that is more favorable. This research was not produced in whole or in part by cherry picking.
This simulation is based on an account with tax exempt or tax deferred growth. Taxable accounts will have to pay the appropriate taxes for dividends, interest and capital gains, which will decrease the performance depicted.
This simulation is not based on actual trading accounts or account composites which may or may not exist for this strategy and may be materially different including worse than the performance illustrated above. Past performance is not necessarily indicative of future performance. Performance results including risk, return and diversification measures are not guaranteed to persist in the future.
This historical performance simulation has been adjusted to reflect estimated management fees.
The suitability of this portfolio strategy requires that you have thoughtfully and accurately completed your investor objectives from your accounts’ Investment Policy Statement. https://portfoliothinktank.com/portfolio-think-tank-login/
Diversification strategies alone cannot assure a successful investment outcome. Strategies offering greater diversification cannot guarantee any reduction in loss of capital.
Your ability to follow this investment strategy is a risk. Investors often dispose of successful strategies at inopportune times thus turning potentially profitable strategies into losses.
Portfolio data is taken from sources believed to be accurate, however, there is no warranty or guarantee as to the accuracy or completeness of data and statistical calculations thereupon. Our performance results are not audited or otherwise approved by any regulatory agency. We regularly perform quality and accurate tests on our calculation and algorithmic procedures. Portfolio ThinkTank does not furnish investment advice without an investment advisory agreement.
The period of time selected for analysis may have a significant bearing on the relative attractiveness of the strategy and the strategy versus another portfolio or benchmark. The author of the strategy controls the default period of time used to analyze performance and from there, users may select any desired period of time from the menu. In general, longer periods, greater diversification and lower concentrations of holdings result in more credible, more persistent performance.
We are unaware of any errors at the time of writing.
