


Asset Allocation

Optimization
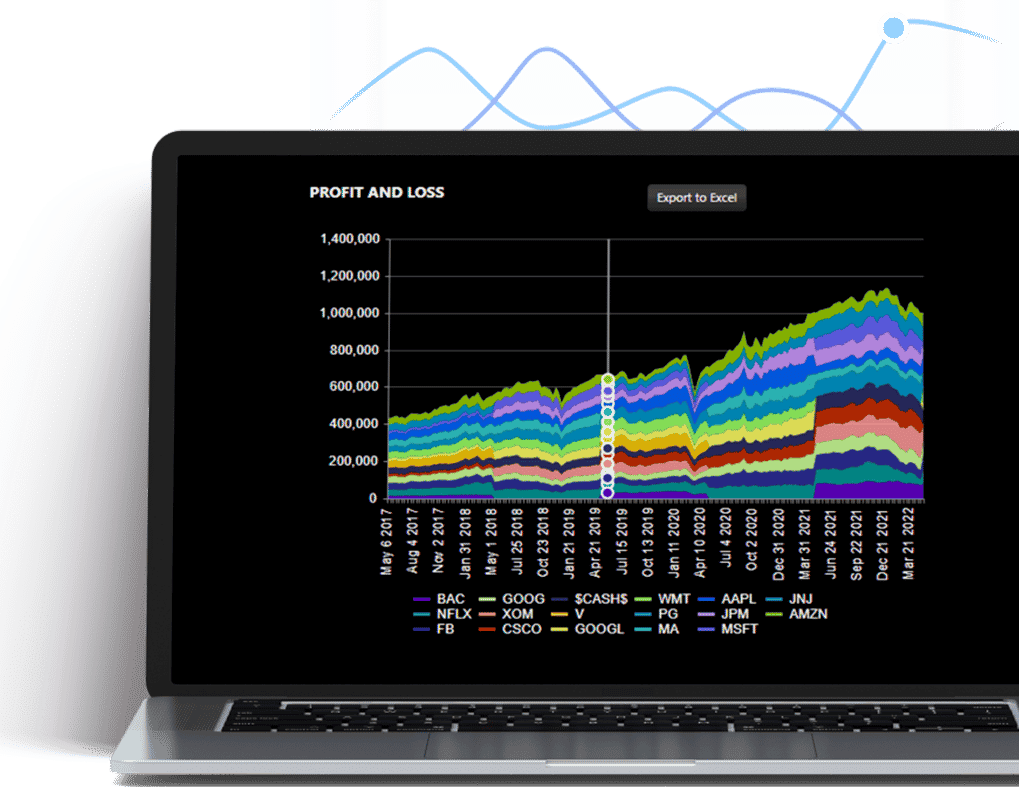
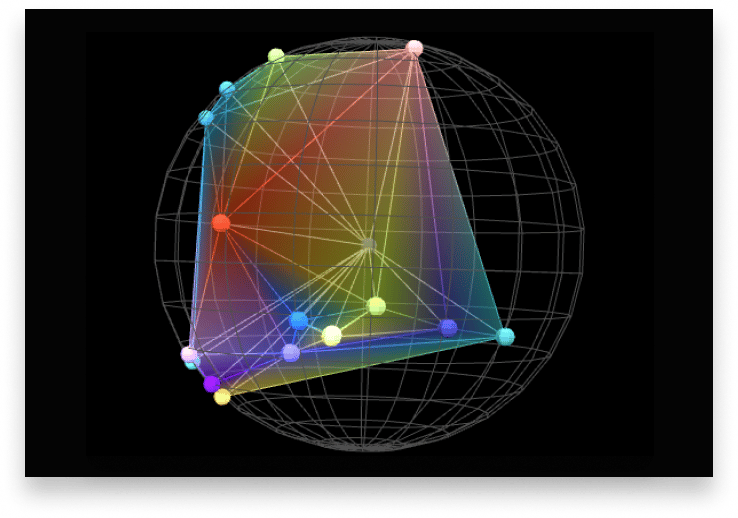

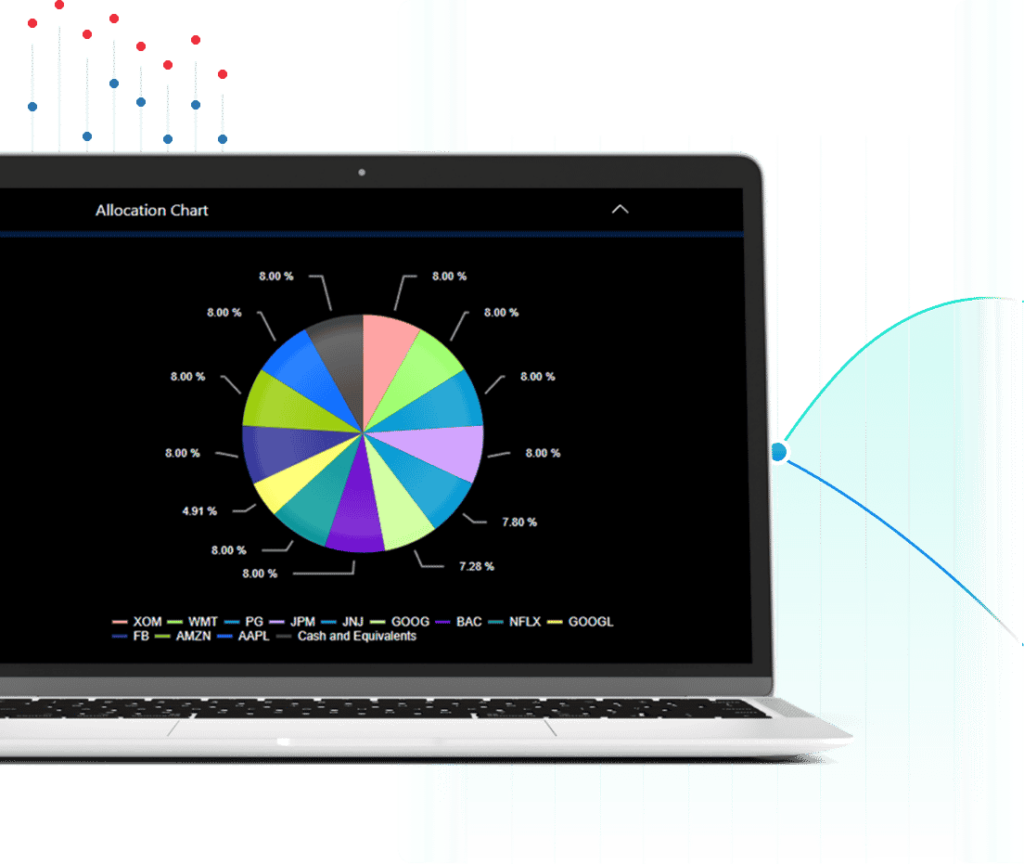
Portfolio Visualization

Re-Optimization
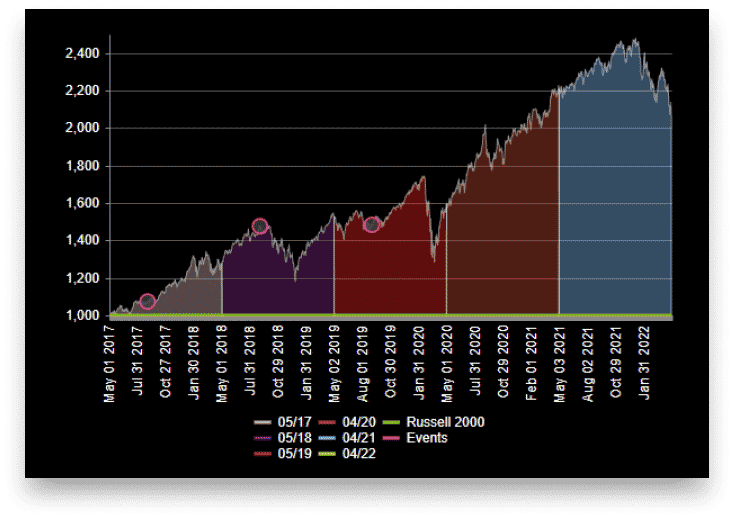
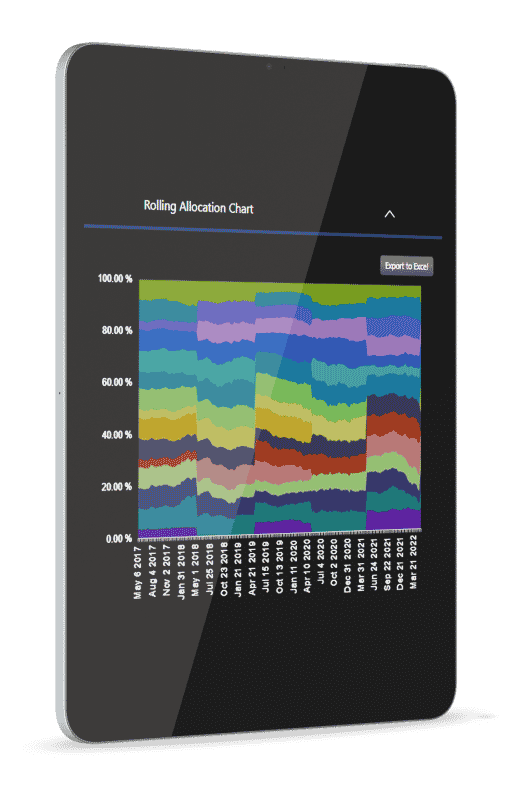

Backtesting

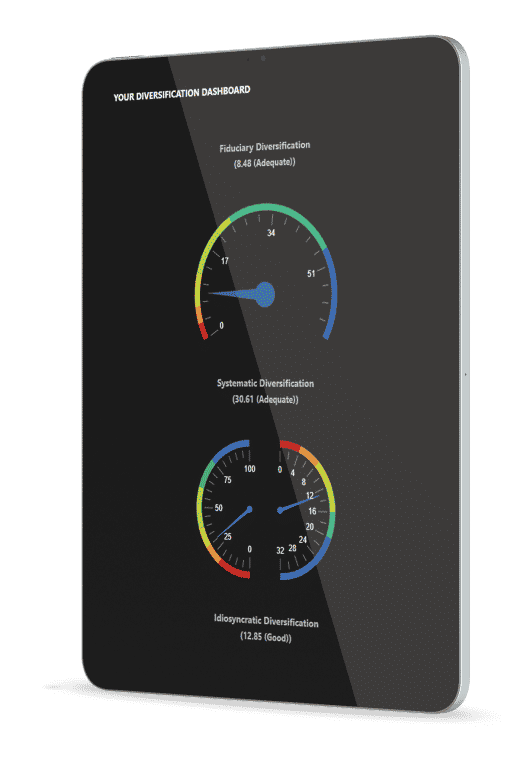
Diversification Analytics
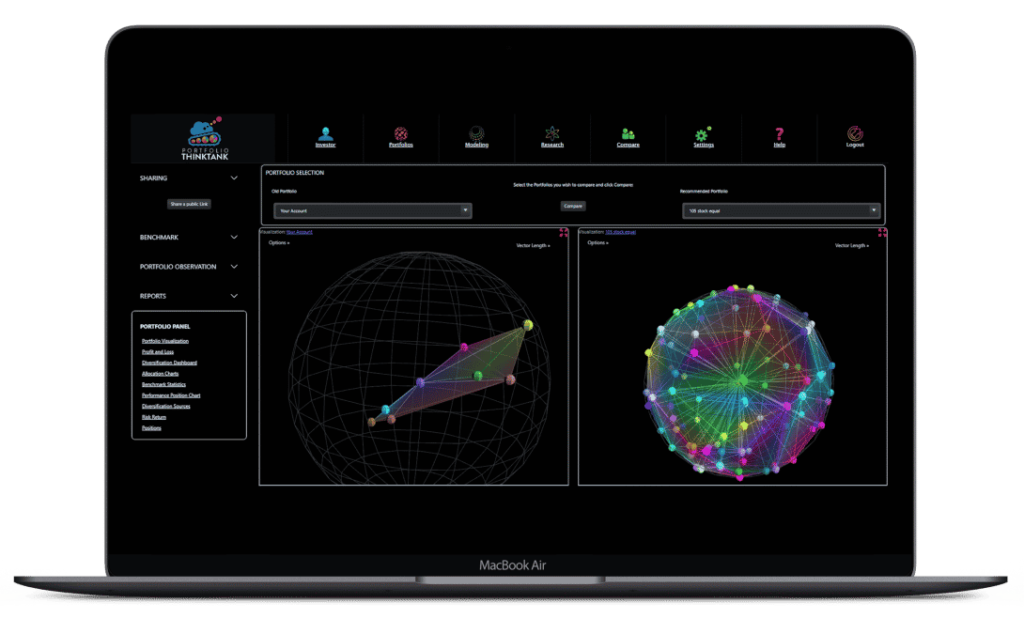

Portfolio Visualization & Comparisons
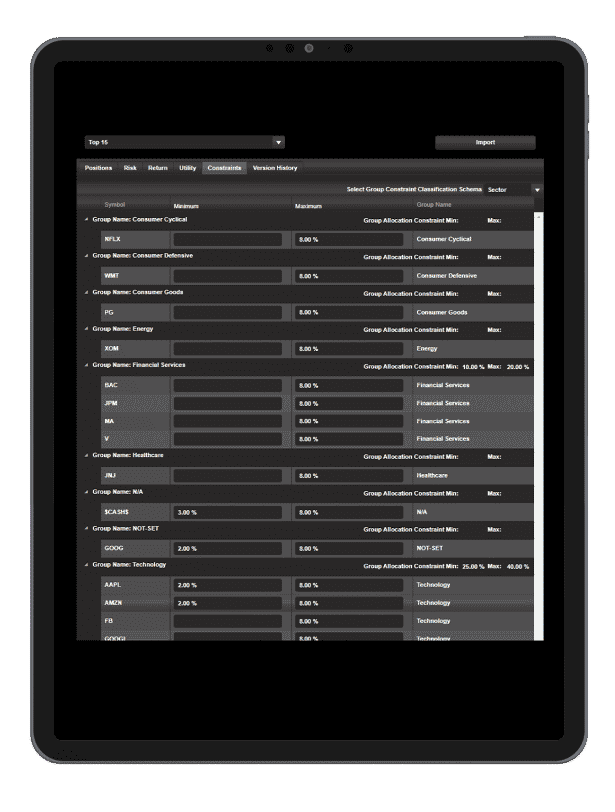

Constraints

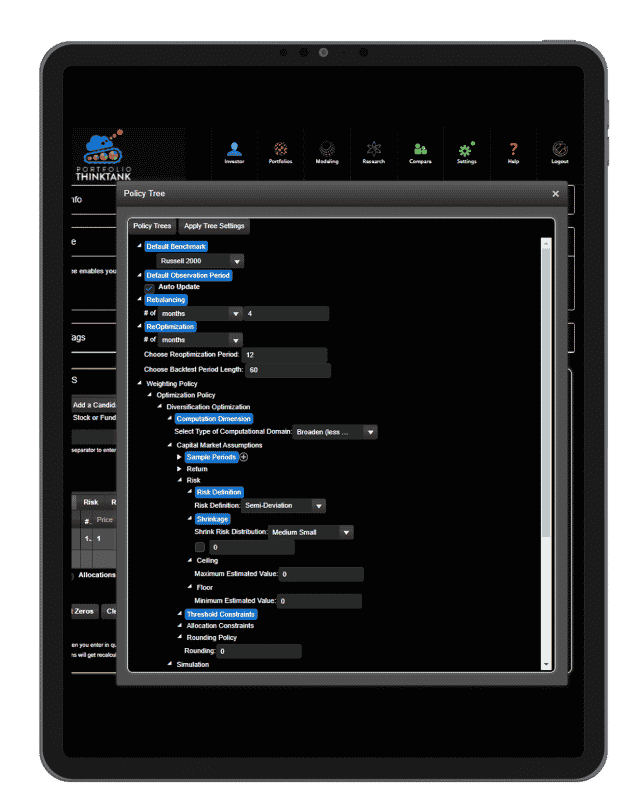
The Policy Tree


Jeremy J. Black
Founder and inventor of RAMCAP, the "intelligent asset allocator" one of the first desktop investment diversification systems; Former Adjunct professor to the College for Financial Planning; Co-Creator of one of the first "Fund of Funds" hedge funds - twice named in the top 10 by the Wall Street Journal.